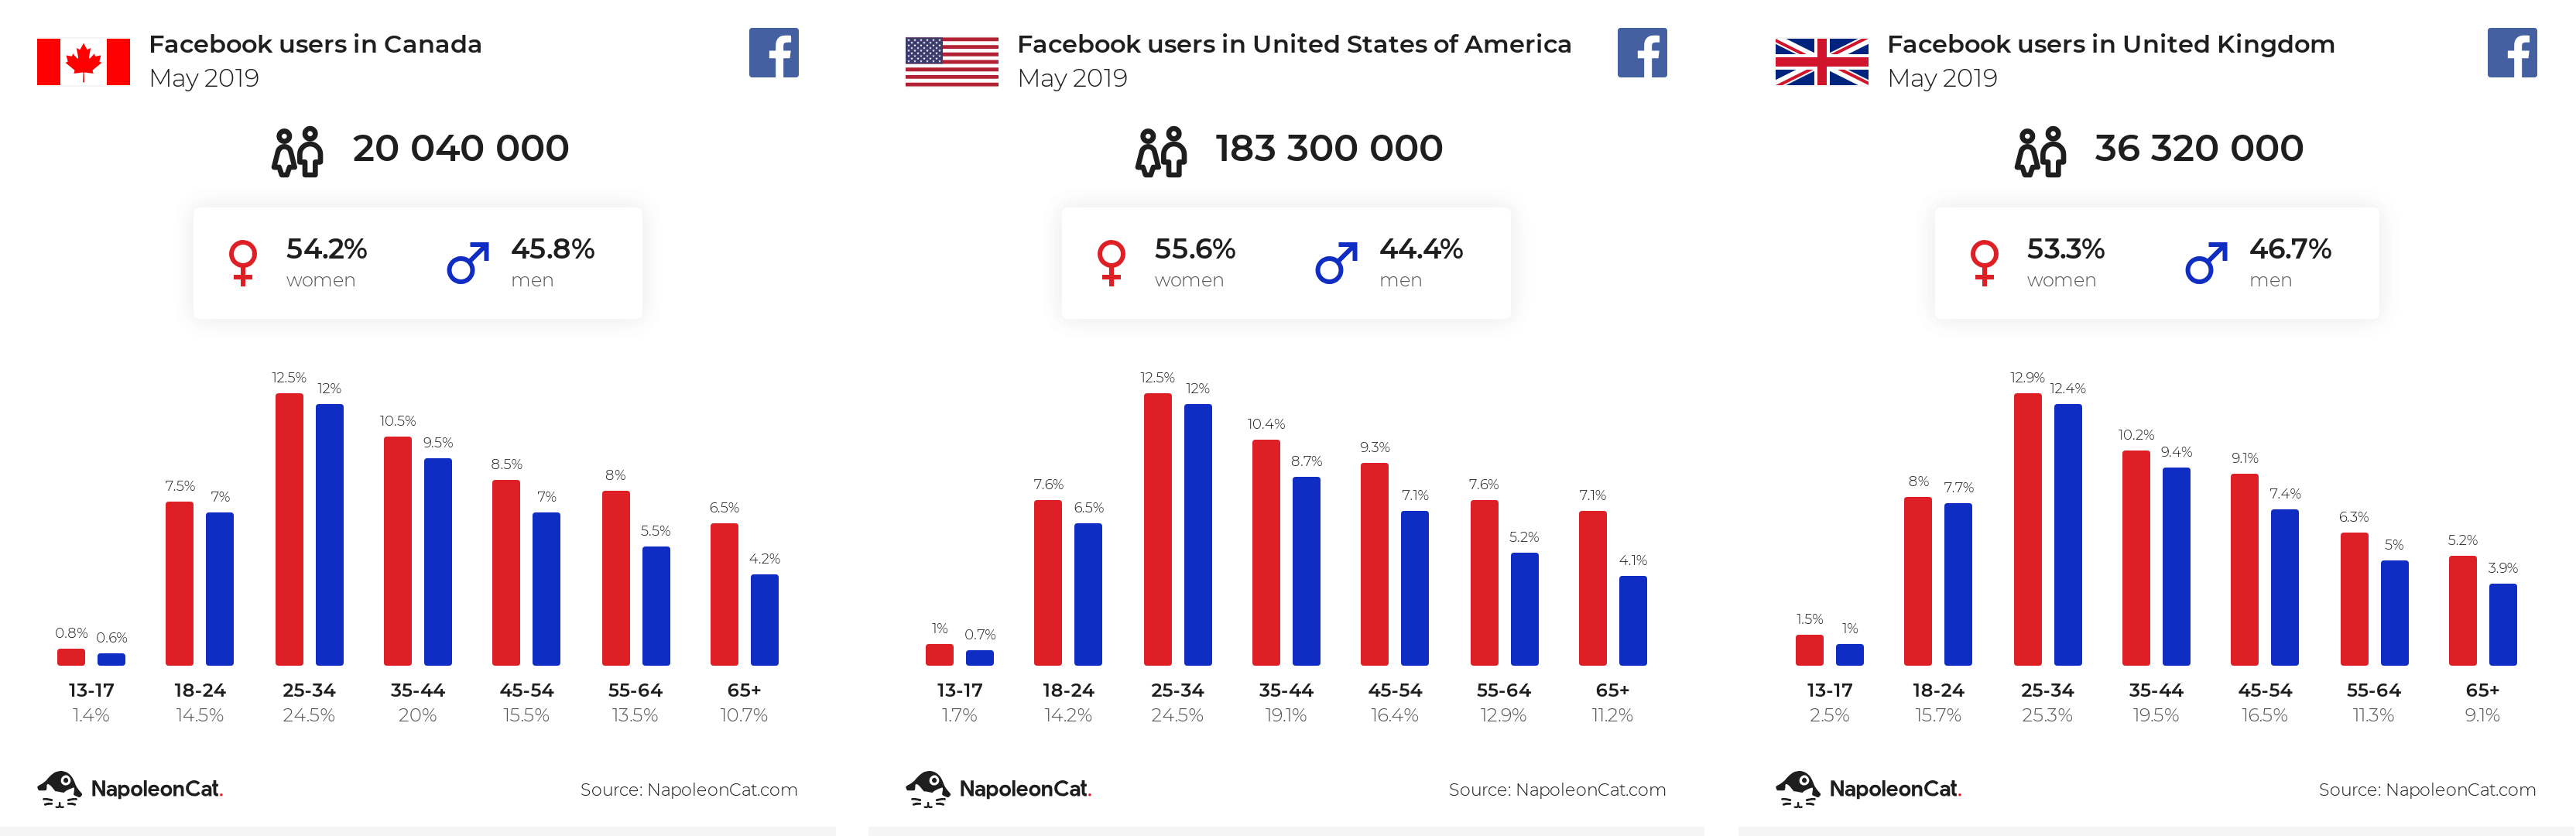
With over 2.3 billion monthly active users, Facebook is a dominant power within the social media landscape. Despite reports of stalled or declining usership in Europe and North America, the number of users worldwide has been growing consistently since the platform’s introduction. Statistics speak loud and clear: Facebook remains a relevant platform for promoting businesses big and small.
For marketers and Facebook Business users, the beauty of the social network lies in its unparalleled user base complemented by advanced targeting options. However, the platform’s intricate and frequently updated solutions for businesses can be quite difficult to navigate.
But navigate them you should. Without analytical insights, you can’t be sure if your Facebook presence is bringing you any closer to achieving your business objectives. Understanding Facebook analytics can help you better recognize your audience’s needs and make data-informed adjustments to your strategy.
Learn how you can harness some of Facebook’s staple analytical solutions one at a time, with specific goals in mind.
Adjust posting times with Facebook Insights
Let’s begin with the basics. Facebook Insights are a good starting point – easily accessible and comprehensible, they include key metrics and allow you to assess page and post performance at a glance.
Access the tool through the top bar on your Facebook Page:
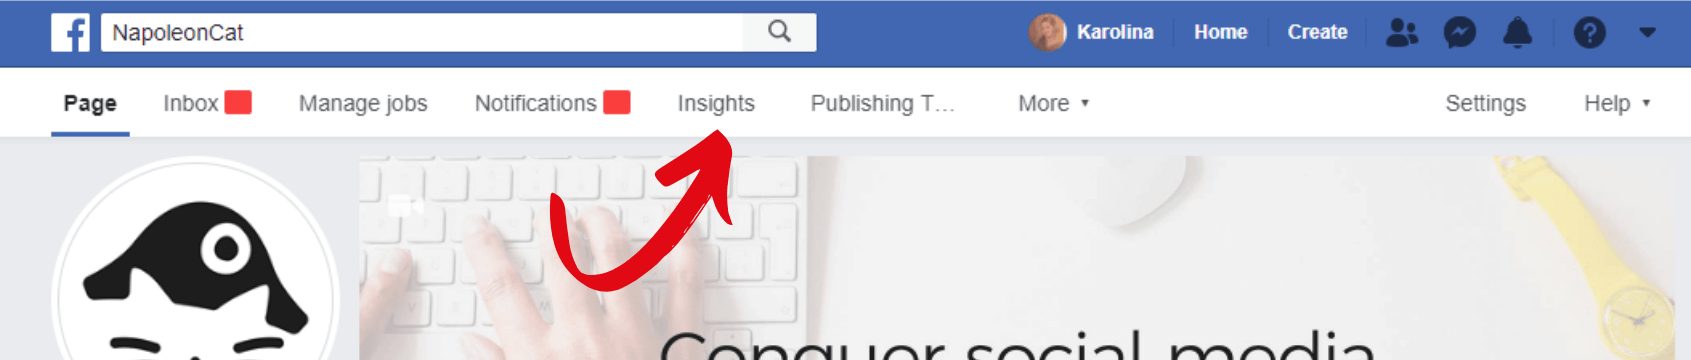
Once you access Insights, you will be taken to the Overview section. This is where you can see high-level information regarding the performance of your whole page, your most recent posts, and the pages you’re watching. This section is perfect for daily check-ins and monitoring the big picture.
For more granular information, use the sidebar to access Insights for specific areas of performance: ads, followers, likes, reach, page views and previews, actions on page, posts, events, videos, stories, people, and messages.
Within the Posts section, you can find out when your fans are online. A detailed graph illustrates when your audience is active, breaking data down into days of the week and times of the day (note: the times of day are shown in Pacific time).
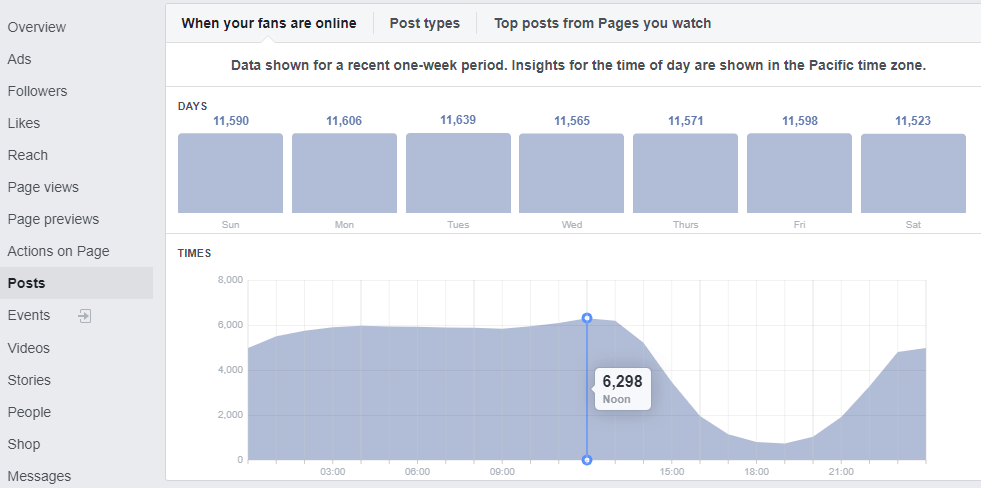
There you go! Adjust your posting schedule to match your audience’s periods of activity and increase your content’s organic visibility. Easy, right?
Social media analytics
Measure your social media marketing results. Track competitors and improve performance using simple dashboards.
Try NapoleonCat free for 14 days. No credit card required.
Refine your strategy with Audience Insights
As mentioned before, Facebook Insights is a great tool for daily analysis of high-level performance indicators. But what if you need more audience-related information to build advanced strategies? Facebook Business Manager offers a more sophisticated and in-depth analytical tool that allows you to analyze insights extending beyond your brand’s fanbase: Audience Insights.
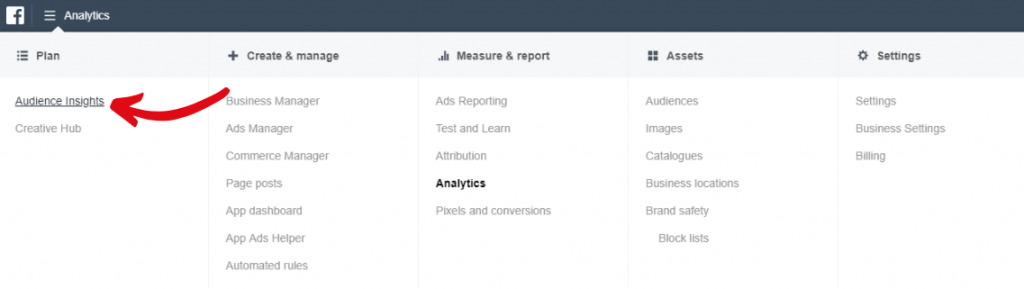
Using Audience Insights, you can create custom audiences based on parameters relevant to your business. This means you can design an audience that perfectly represents your business’s target group and analyze their online behaviors in great detail. Here is how to get started:
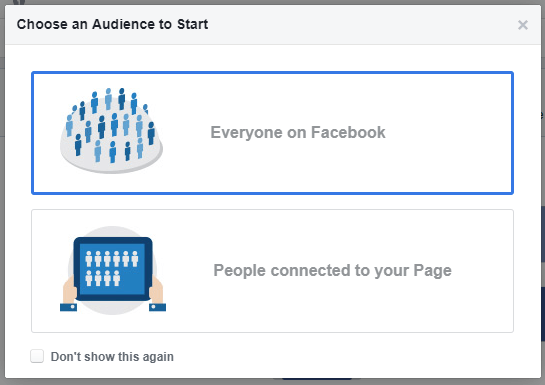
- Select “Everyone on Facebook” in the pop-up window that shows up after you access Audience Insights
- Adjust the location settings to include geographical locations you want to analyze; you can be as specific as you please – Facebook allows you to sort audiences by cities or, in some cases, even neighborhoods
- Specify the age and gender of your custom audience
- Add interests – pick from dropdown lists or begin typing for suggestions
- Define if you want to limit your custom audience to people specifically connected or not connected to the pages you manage
- If necessary, define advanced parameters: language, relationship status, education, politics, etc.
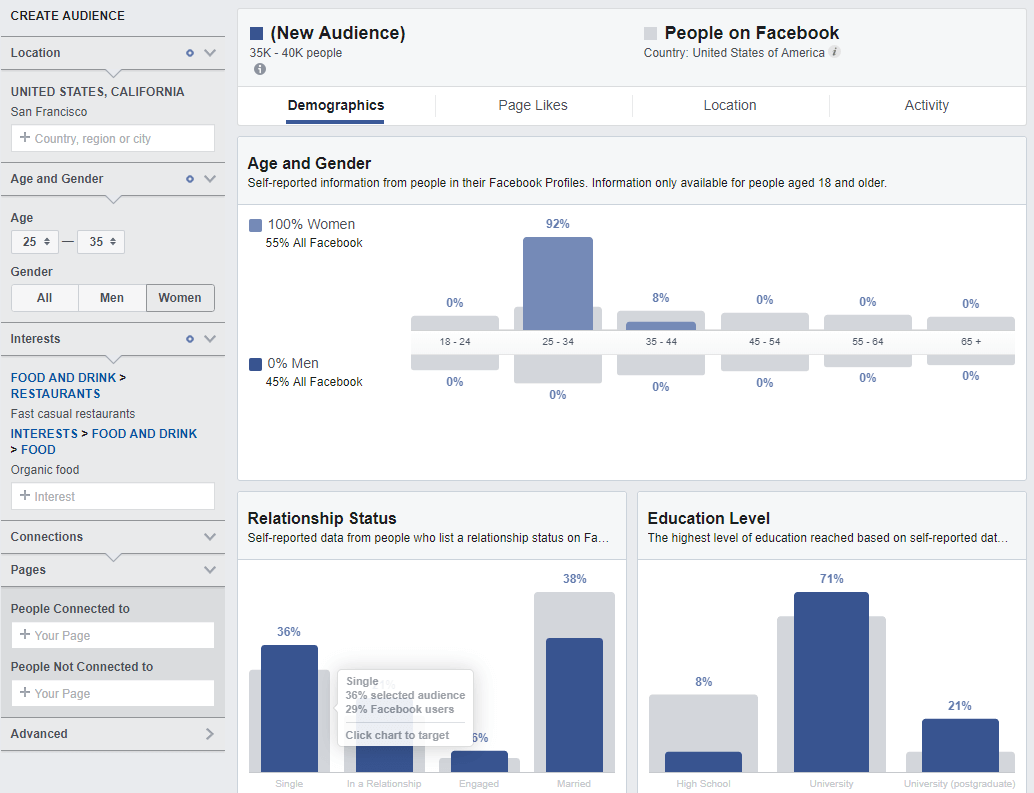
Once you set up your parameters, the dashboard will show you the total number of users that match your search as well as detailed information regarding your newly created audience. You will also see how it compares to all Facebook users from your selected countries.
Here is where it gets really interesting. Select Page Likes from the top bar to see the entertainment websites your audience follows, the cinemas, music venues, and clubs they frequent, the events they attend. You can see their favorite coffee shops, museums, shopping centers and find out which politicians and public figures they support. The list of categories goes on.
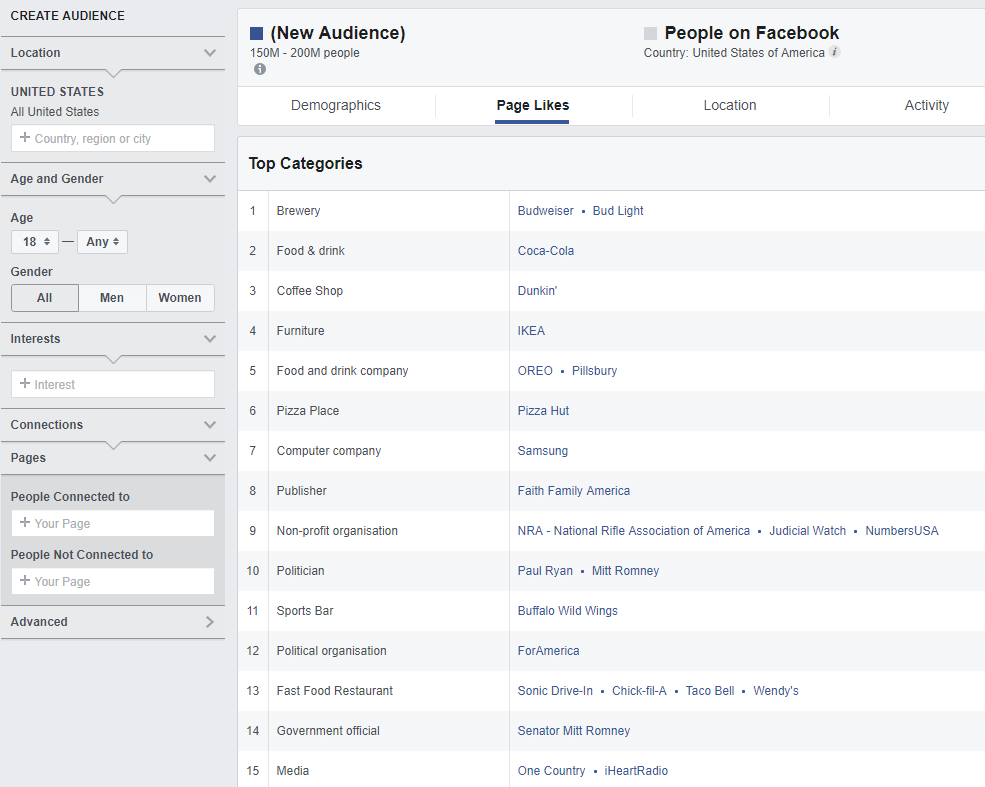
How does this benefit your business? Audience Insights provide you with valuable information regarding the groups you should be targeting with your organic content. The process leaves you with a list of online and offline news outlets your audience follows and trusts as well as businesses they frequent and services they enjoy. Use this information to create a meaningful PR strategy and establish collaborations with relevant businesses. Simply speaking, connect with your audience in their comfort zone.
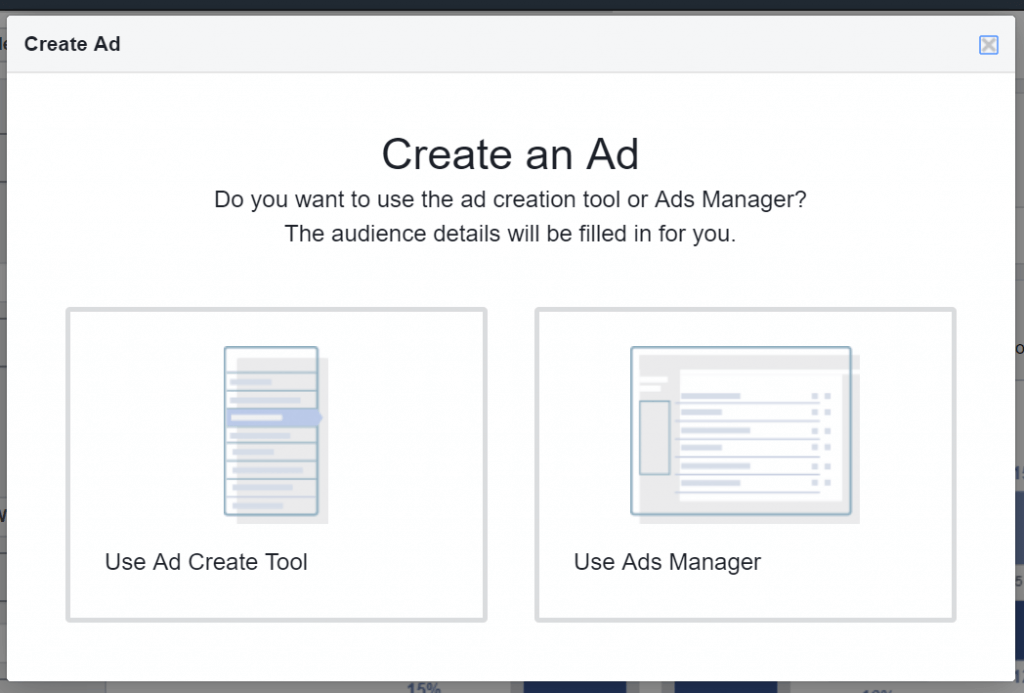
Finally, you can target these newly discovered audiences with Facebook ads without leaving the Business Manager panel. All you have to do is click the Create Ad button in the top right corner of the dashboard. Pick the method of creating an ad that works best for you – your audience details will be filled in for you regardless of your choice.
Optimize conversions with the Facebook pixel
Facebook Analytics is a powerful tool that comes close to Google Analytics when used to its full potential. The Facebook pixel, in particular, allows you to track a user’s actions across paid and organic Facebook content and your website(s), helping you better understand the needs and motivations of customers visiting your pages. Effectively, it equips you with valuable insights regarding your sales funnels and allows you to attribute conversions and create custom audiences for paid efforts.
But what, exactly, is the Facebook pixel? It’s a piece of code that, when added to your website, reports customers’ actions back to Facebook and integrates that information with Facebook Analytics.
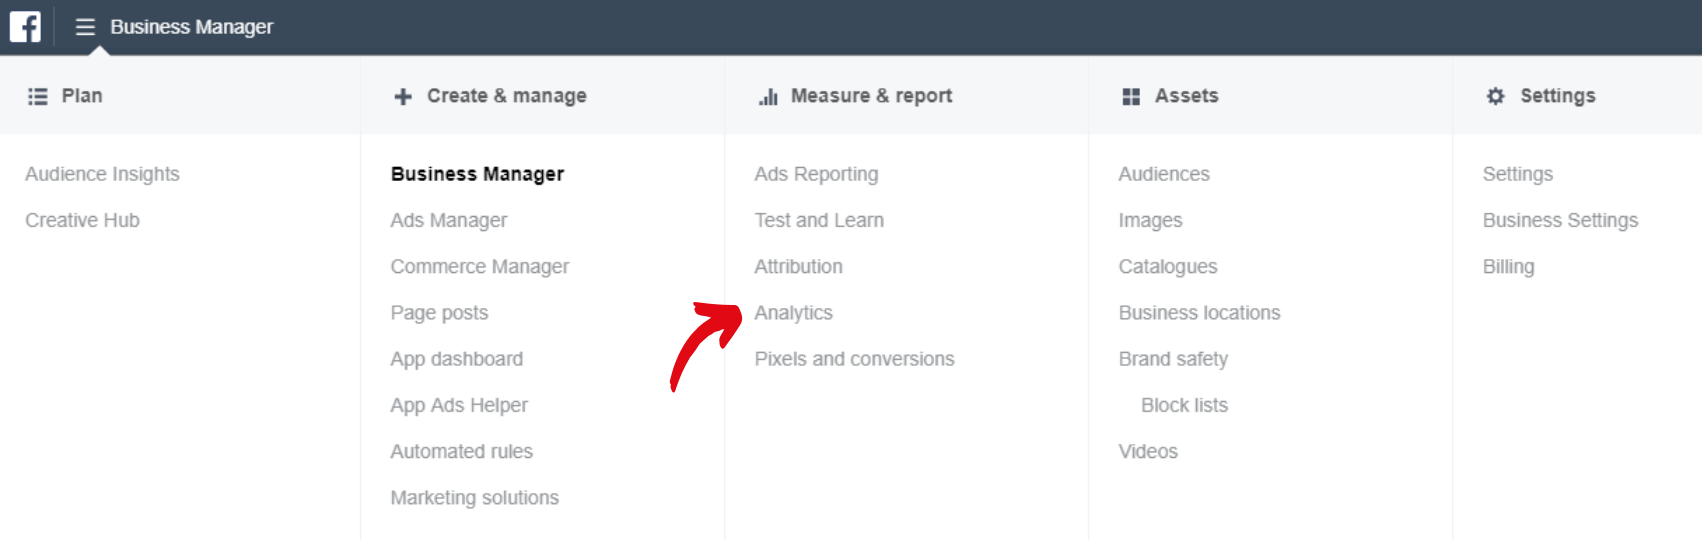
In order to set it up, go to Pixels and conversions in the top menu in Business Manager. You will be taken to the Events Manager where you can set up data sources, including the Facebook pixel. Click the “Get Started” button and fill in your website information in the pop-up that shows up on your screen. Once the code is generated, you will be able to set up the pixel manually or using partner accounts.
The next step is setting up events, i.e. specific user actions on your website that will be tracked by Facebook Analytics. You can pick from a standard list provided by Facebook (including viewing content, adding an item to cart, completing a purchase) or set up custom events (e.g. starting a trial). Setting up events also requires injecting code into specific pages on your website. You can do this manually, with the help of a developer, or using an external tool.
Once you set up your pixel and events, it’s time to organize the collected data. The pixel will report user actions to Facebook Analytics, but in order to make sense of that information, you have to create funnels, i.e. sequences of customer behaviors that lead to desired outcomes: a purchase, registration, or any other form of conversion.
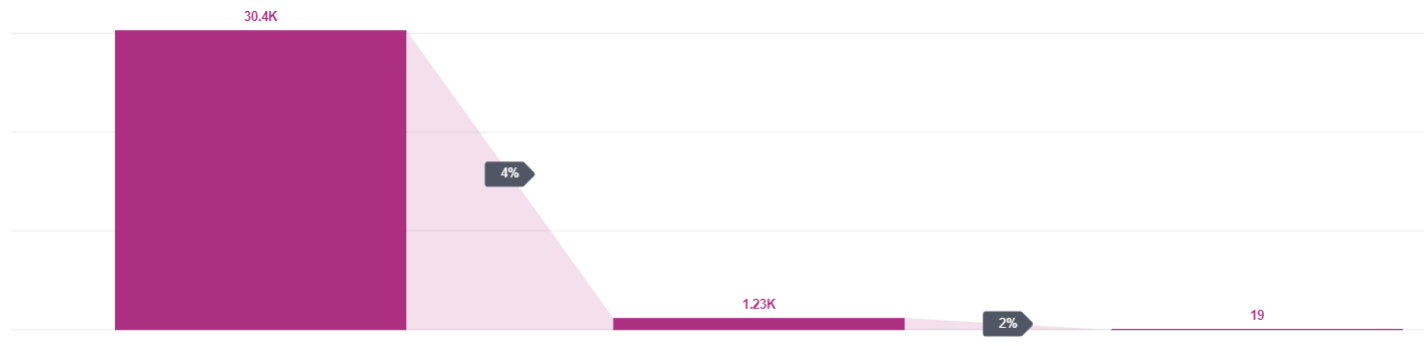
Funnels are a great way to visualize your customers’ journeys and recognize pain points. They illustrate when your customers leave the shopping cycle, highlighting areas of improvement. But how can you use these insights to improve conversion rates?
Start by reevaluating the elements of your website that cause users to leave. Perhaps some of your webpages are not easy to navigate? Conduct a UX audit and use your conclusions to improve the usability of your website. Sometimes simple tune-ups can help, e.g. adding calls to action along the sales process or using simple language rather than specialized jargon.
You can also utilize Facebook Analytics to target groups of users that make it to particular steps of your funnels with custom ads. Understanding when they leave the sales process provides you with valuable insights regarding their expectations and motivations. Present these users with meaningful ads that address their specific needs to bring them back into the loop.
And that’s it. You can now start using Facebook analytics to optimize your Facebook marketing efforts. As with any strategic work, make sure to check back on your stats and always take note of changes. A good Facebook strategy is one that works and considering how dynamically things change on social media, occasional adjustments are inevitable. But you already know that, don’t you?
For simplified and automated insights, try NapoleonCat. Our analytics tool allows you to work on social profiles from multiple platforms (including Facebook). Use simple dashboards to track metrics and generate customizable reports, and easily identify changes in performance with readable graphs. Sign up for a free trial here.